Large efforts have been dedicated to developing soil acidification models for use on different scales. In order to gain insight into the effects of model simplification, a site scale soil acidification model (NUCSAM) and a national to European scale soil acidification model (SMART2) were applied to the Speuld forest, the Netherlands. NUCSAM was calibrated and validated to a roofed manipulation experiment with reduced acid deposition. SMART2 was used afterwards, using calibrated input data from NUCSAM. The acid exclusion is achieved by means of a roof beneath the canopy. NUCSAM was calibrated on the ambient plot, followed by a validation of both models on the pristine plot.
Both models predicted soil solution concentrations within the 95 % confidence interval of the observed responses for both the ambient plot and the pristine plot at 90 cm depth. Despite the large seasonal and vertical (spatial) variation in soil solution chemistry, the trends in annual flux-weighted soil solution parameters, as predicted by SMART2 and NUCSAM corresponded quite well (Figures 1 & Figure 2). The annual leaching fluxes below the root zone were similar, although differences exist for the topsoil. For the topsoil NUCSAM simulated the nutrients and acid related constituents better than SMART2. Both models overestimated the ammonium concentration at 10 cm depth. SMART2 underestimated BC2+ concentration at 10 depth, whereas NUCSAM overestimated BC2+ concentration at 90 cm depth.
Figure 1
Simulated and observed flux-weighted annual average concentrations of NH4+, NO3- and BC2+ (Ca2+ + Mg2+) at 10 cm and 90 cm depth for the ambient plot. For the observations the error bars of the 95% confidence interval are included.
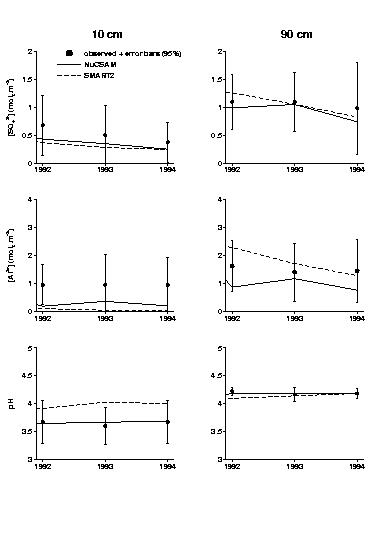
Figure 2
Simulated and observed flux-weighted annual average concentrations of SO42-, Al3+ and pH at 10 cm and 90 cm depth for the ambient plot. For the observations the error bars of the 95% confidence interval are included.
NUCSAM predicted the effect of deposition reduction on N concentrations well at both depths, whereas SMART2 underestimated the effect of deposition reduction at 10 cm depth (Figure 3). Both models calculated faster effects of deposition reduction on Al, SO4 and base cations than observed. Generally it appeared that the differences were large during the period of profound deposition changes, whereas small differences occurred during slight variations in deposition level. It was concluded that a simpler model description does not have a significant impact on the model performance considering flux-weighted annual average concentrations at greater depth, whereas the performance decreases at a lower depth. Model improvements have to be focussed on processes related to N-dynamics.
Figure 3
Predicted and observed relative effect (%) of throughfall reduction on Al3+, SO42-, N and BC2+ concentrations to the roofed ambient plot at 10 and 90 cm depth.