 |
||
 The James Hutton Institute
This page is no longer updated. The Macaulay Land Use Research Institute joined forces with SCRI joined forces on 1 April 2011 to create The James Hutton Institute.
 This page has been mothballed.
It is no longer being updated but we've left it here for reference.
Geographic Analysis
Background
This section presents a summary of methods for the geographic analysis of VIA and worked examples of those methods as applied to wind turbines, wind farms and the cumulative impact of additional turbines and farms. Two sites have been chosen to demonstrate the methods, one in Wales and the other in Scotland. The land use, topography and range of data available is different for each site but a consistent approach has been employed to provide comparable results although aspects of data reliability are dealt with for only one site and are reported in the section on error modelling.
The basic data and analysis requirements were identifed in the Information Products outlined in Task 1 and recorded in Appendix 8. A discussion of the methodologies employed, the nature of the results, their reliability and limitations and the means of presenting the data, methods and conclusions to an audience is translated into recommendations in Task 5.
Site Selection
Scottish Site: Glens of Foundland
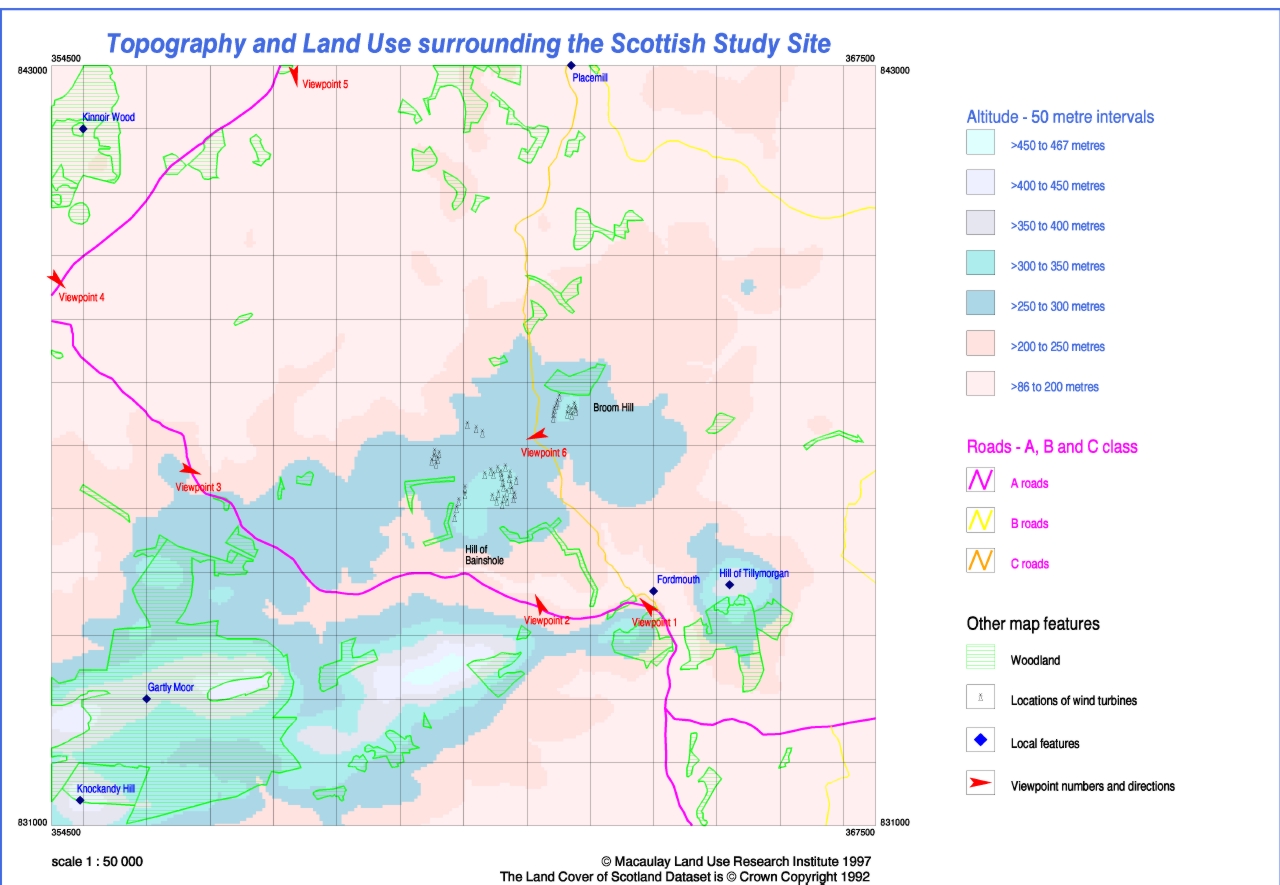
The Scottish study site is centered on the range of hills in central Aberdeenshire (Figure 4.1.1), between the towns of Inverurie (to the south) and Huntly (to the north) the pass through which is known as the "Glens of Foundland" (grid reference, NJ6035). Selection of the site was based upon:
- Suitability for the development of a wind farm;
- Availability of data to undertake each of the forms of visual impact analysis (geographical, photographic and three-dimensional modelling) that were required.
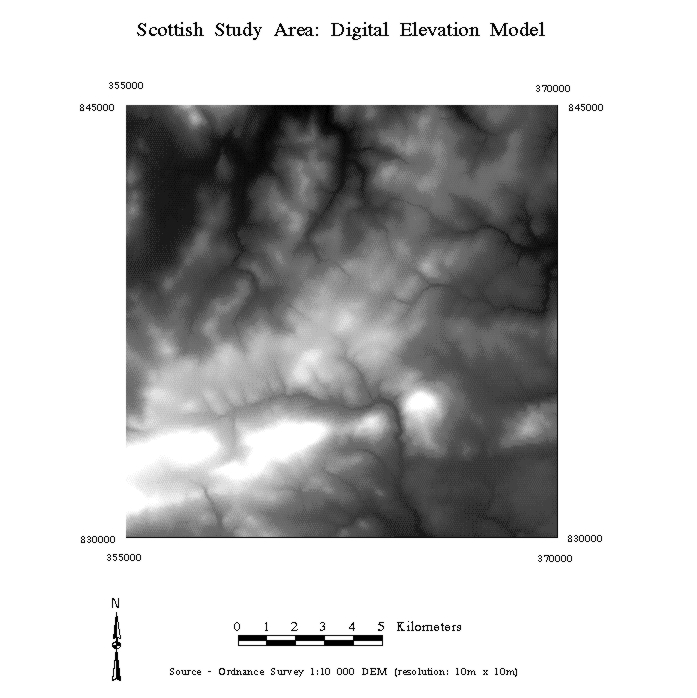
The study area comprises two parts, one of which is 25km x 25km in extent (the elevation for which is at a scale of 1:50 0000 and the second of which is 15km x 15km (the elevation data for which is at a scale of 1:10 000) and is within the extent of the larger area (Figure 4.1.2).
Site Suitability
Aberdeenshire Council were approached for suggestions as to sites of local interest for wind farm development. A list of 46 sites were provided ranging from proposals for single turbine to farms of 60 turbines. From this list, and with a view to comparability with the number and dimensions of the turbines in the Welsh study site, the sites at Hill of Bainshole (NJ6136) and Broom Hill (NJ6338) were chosen.
Data Availability
The principal data required were digital elevation models and the locations of the (prospective) wind turbines. Data on the road network, land cover, satellite imagery and aerial photography were also available for the study area and were used either for purposes of site description or for the 3D modelling and visualization work. Paper copies of the 1:10 000 scale base maps were provided for the work on error modelling.
In total the prospective locations of 50 wind turbines were selected and used in the geographic analysis and associated error modelling and these are shown in (Figure 4.1.1). Also shown are the six locations from which the photographic modelling was undertaken.
| Scottish Study Site, Glens of Foundland | ||
|---|---|---|
| Study Site Map | DEM, 1:10 000 | DEM, 1:50 000 |
 |
 |
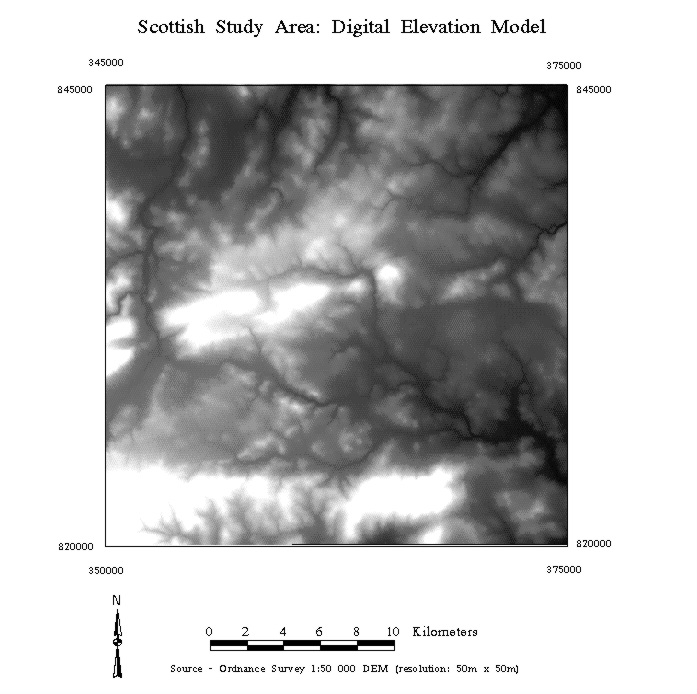 |
Figure 4.1.3 Illustrations of data for the Scottish study site
Welsh Site - Carno and Mynydd Rhiw-Saeson
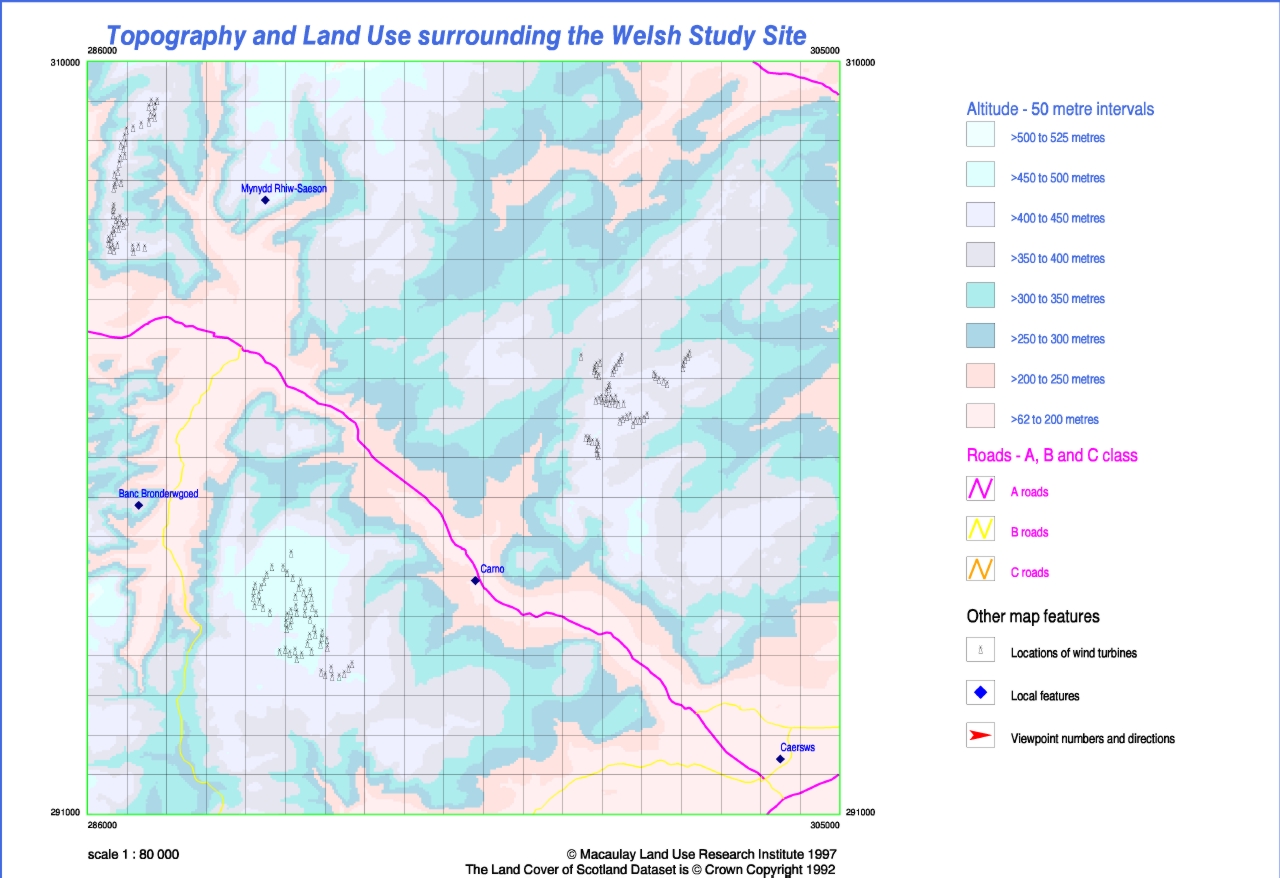
Selection of the Welsh site was based upon the existence of a number of wind farms in close proximity and the liklehood of a future proposal being submitted. The site is an area 19km x 19km in Powys in Mid-Wales, centered on the A70 trunk road and the town of Carno. This area includes five extisting wind farms (the details of which are presented in Table 4.1.1) grouped into three main area which are broadly to be found in the north-west, east and south-west of the area. Therefore, the area can be used as an example where the cumulative ZVIs may be determined with respect to the landscape in general and the road network in particular. Only one scale of elevation data was used for this site, that of 1:50 000.
| Welsh Study Site, Carno and Mynydd Rhiw-Saeson | |
|---|---|
| Study Site Map | DEM, 1:50 000 |
 |
|
Figure 4.1.4 Illustrations of data for the Welsh study site
Wind Turbines
The wind turbines which are in place in the Welsh study area range in height from 31m to 65m (to top of rotor arc). In total the locations of 228 turbines were used, comprising the 171 which were commissioned between November 1992 and early 1997 and a further 57 that are currently being planned. The developers of the wind farm at Mynydd Hendre are currently in the process of obtaining planning permission.
| Wind farms in Welsh study site | |||||
|---|---|---|---|---|---|
| Carno A | Carno B | Mynnydd y Cemmaes | Mynnydd y Cemmaes B | Mynydd Hendre | |
| No. Turbines | 56 | 30 | 24 | 8 | 57 |
| Min. Tower Height (m) | 31.5 | 32 | 25 | 35 | 41 |
| Max. Tower Height (m) | 31.5 | 32 | 25 | 35 | 65 |
| Max. Rotor Diamater (m) | 44 | 32 | 33 | 33 | 33 |
| Operator | NWP | NWP | NWP | NWP | NA |
| Operational Date | 23/10/96 | 1997 | 1/11/92 | NA | NA |
| Generating Capacity (MW) | 33.6 | NA | 7.2 | NA | NA |
NWP: National Wind Power
NA: not available
Objectives of the Analysis
The geographic analysis is intended to illustrate some of the methods that can be employed for assessing the visual impact of wind turbines and as a means of raising and discussing some of the issues associated with any such analysis. Issues of error and accuracy are addressed below but a comprehensive appraisal of these issues is reported in the section on modelling geographic error. The groups of analysis which were carried out are as follows:
- Visibility census;
- Visibility scoring and ranking;
- Visibility levels by turbine location and height;
- Accumulated visibility of turbines;
- Accumulated visibility of wind farms;
- Visibility of turbines with respect to road network;
- Visibility of turbines with respect to road type;
- Accumulated visibility of turbines with respect to road type;
- Turbine locations with respect to viewer's horizon;
- Relative exposure of wind turbines;
- Combined analysis of turbine exposure and accumulated visual impact.
The following sections describe the analysis that was undertaken for each study site and the results that were obtained.
1. Visibility census
A census of visible land was calculated based upon a digital representation of the terrain. This provides a surface representing the relative visibility of each point on the terrain with respect to its surroundings.
A calculation of intervisibility was undertaken for each cell and the total area visible was recorded as one of its attributes. Each cell in the elevation model is counted only once, although the calculation could be weighted according to the inverse of the distance from the cell. In practise the calculation of the intervisibility of every cell from every other cell is highly CPU intensive and a surrogate approach can be used which employs a sample of points across the terrain (Miller et al, 1995).
The surrogate approach was based upon calculating the intervisibility of sample points from every grid cell in each DEM according to the following details:
- 1:50 000 DEM
- Point spacing - 250m x 250m;
- Grid cell spacing - 50m x 50m;
- Maximum distance of view - 50km and 3km.
- 1:10 000 DEM
- Point spacing - 100m x 100m;
- Grid cell spacing - 10m x 10m;
- Maximum distance of view - 1km.
The outcome of this analysis is a scoring of relative visibility across each study area. In general, the more enclosed an area the fewer point would be visible and, conversely, the more open the land the greater the number of points would be visible. Enclosed land tends to be that with valley sides that are closer to the observer, narrower valley bottoms and thus a lower area of visible land.
The implementation of this approach was in ArcInfo using the GRID module (ESRI, 1995) details of this approach are outlined in Miller and Law (in press) and the command employed is recorded in Appendix 6.
The calculation of the visibility census has been carried out for each study site using the 1:50 000 DEM and also the 1:10 000 DEM for the Scottish site, the outputs of which are illustrated in Figure 4.1.4.
Figure x contains histograms of the visibility levels within each site and the distribution of those visibility levels for different wind farms or scenarios of turbine locations.

2. Visibility scoring and ranking
Scottish site
Figure x shows a histogram of the visibility census scores plus the scoring of the land on which the hypothetical turbines have been located according to the two scenarios.
Welsh site
Figure y shows a histogram of the visibility census scores plus the scoring of the land on which the existing x turbines are located.
3. Visibility levels by turbine location and height
4. Accumulated visibility of turbines
5. Accumulated visibility of wind farms
6. Visibility of turbines with respect to road network
7. Visibility of turbines with respect to road type
8. Accumulated visibility of turbines with respect to road type
9. Turbine locations with respect to viewer's horizon
10. Relative exposure of wind turbines
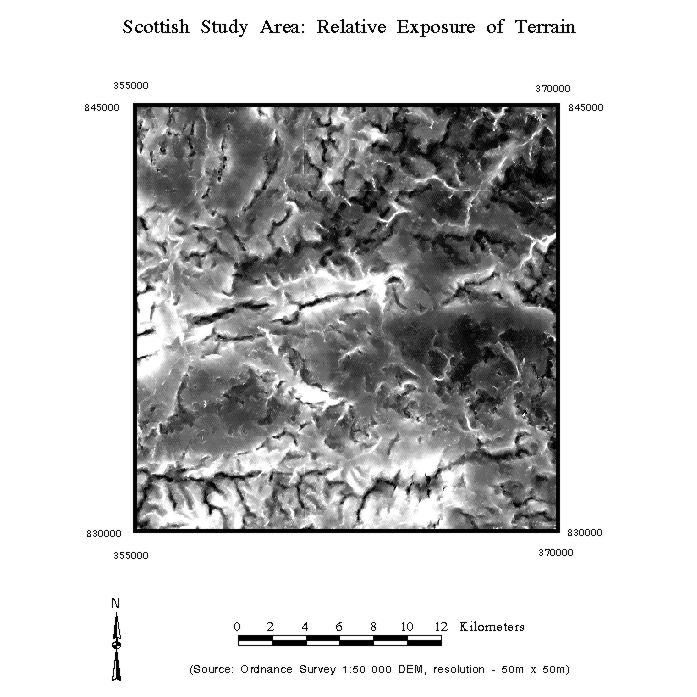
The relative exposure of terrain to prevailing winds does not, of itself, provide a basis for determining the best locations for wind turbines. Other relevant factors include wind speed, connectivity into an electricity transmission network, site stability and constraints imposed by land designations (Task 3) (REFERENCE). However, relative exposure is closely correlated with visibility (REFERENCE) in the landscape and thus any preference for locations with a high exposure to prevailing winds is likely to lead to the identification of sites with a high level of visibility from surrounding land.
One component of the assessment of visual impact (total visibility) can be used in combination with estimates of relative visibility to intimate where there may be land with a high relative exposure and yet a relatively low visibility score.
The method identified for the calculation of relative exposure is that which is operationally used by the forestry industry during the planning of afforestation and re-afforestation, namely xx (REFERENCE). The basis for this calculation is a summation of the vertical angles to the horizon in each of the eight cardinal directions of the compass, weighted by topographic aspect.
Figures x and y show the relative exposure of the two study sites. The areas of highest exposure in the Scottish site are xx and in Wales are xx. Figure x shows the distribution of the wind turbines according to their relative exposure (in Wales they are colour coded by farm). This illustrates that ...
Figure x shows the output of the DAMS scoring for the Scottish study site and Figure x illustrates the same calculation for the Welsh site.
10. Combined analysis of turbine exposure and accumulated visual impact
- Sequences of elevation models and visibility levels for each study area
- Selection of demonstrator site
References
Miller, D.R. Brooker, N.A. and Law, A.N.R. (1995) The Calculation of a Visibility Census for Scotland. In: the Proceedings of the ESRI Annual Conference, Redlands, Ca. USA. May 1995.
Miller, D.R. and Law, A.N.R. (in press) Mapping the Visiblity of Scotland, Cartographic Journal.
|
Updated: 23 January 2024
|