Garden Tiger Moth photographed by Gabor Pozsgai Visit www.photogabor.com This page has been mothballed.

It is no longer being updated but we've left it here for reference.

Further information


3. Fire Risk Mapping

To evaluate fire propagation risk, we implemented Rothermelīs model 1972, 1983) in a spatial form within a piece of software named FireMap. With this tool fire risk maps are produced and used for testing different fuel management strategies and changing wheather scenarios.

Contents

3.1. The fire risk model
3.2. Fuel models
3.3. Software development
3.4. The Computation of Fire Risk maps
3.5. Testing of the fire risk maps
3.6. Scale effects on fire risk mapping
3.7. Testing of alternative silvicultural strategies for minimizing risk

The fire risk model

The calculations of fire characteristics are done using Rothermelīs fire behaviour model (Rothermel, 1972, 1983). This is a semi-empirical model that quantifies the relation between heat source and heat sink and translates this relation into a set of fire behaviour parameters. These parameters are scalars corresponding to one homogeneous terrain unit.

In FireMap, Rothermelīs model is implemented in a spatial form so that fire characteristics are calculated for each cell unit and fire risk digital maps are produced in a raster format for extensive heterogeneous conditions.


Software development

What is FireMap?
  • FireMap is a WindowsTM based GIS application.
  • It was designed to produce maps of Fire Characteristics (rate of spread; fireline intensity; flame length; etc.) and to compute Fire Propagation Risk.
  • The four fire risk levels produced by FireMap are defined based on the difficulty of fire suppression.
What is its scope?
  • Fire risk assessment for regional areas.
  • Evaluation of alternative weather and fuel management scenarios.
How is it implemented?
  • FireMap is a PC based GIS application operating in Windows95, WindowsNT3.51 or any other platform completly compatible with 32 bits operational systems.
  • Development tools: DelphiTM, for the graphical interface design and Borland C++TM , for the calculation modules.
  • A object oriented paradigm has been adopted for the software implementation which enables a structured development of complex alghoritms in a user-friendly environment.
What are the limitations?
  • It assumes homogeneity of condition within each cell of raster maps.
  • It is limited to the prediction of characteristics of surface fires.
  • The appropriate scale of application depends on the problem at hand, and is determined by the spatial and temporal resolution of the avaiable dataset.
Data Inputs:

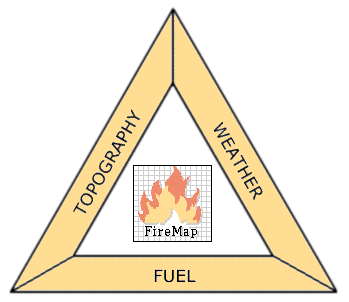
Three major types of data are required for the fire risk calculation:

triang.gif - 9.8 K
Fuel:
  • Fuel models map: A map with the distribution of fuel models (NFFL classification) on the area of concern.
  • Leaf Area Index map: A map showing the LAI of overstory vegetation, that quantifies the attenuation in incident radiation due to interception. This information is needed to compute fine dead fuel moisture in the understory
  • Live Woody moisture map: A map that depicts the moisture content (%) of larger diameter fuel components. Only required for a few specific fuel models
Weather:

A tabular database containing the following variables:

  • Day of the year
  • Time of the day
  • Air temperature (šC)
  • Air relative humidity (%)
  • Wind speed (km.h-1)
  • Wind direction (direction of the compass)
Topography:
  • Digital Terrain Model (m)
  • Slope map (%)
  • Aspect map (degrees)
Data Outputs:

All outputs are produced in the form of maps showing the spatial distribution of the various fire characteristics.

  • Fire rate of spread for each direction of the compass (m.min-1)
  • Maximum flame length (m)
  • Fire line intensity
  • Fire risk (four levels classifying the difficulty of supression)

The Computation of Fire Risk maps

Fire propagation risk is not static, it is dependent on cumulative weather and fuel conditions. Therefore the production of fire risk maps should be able to account for changing situations.

FireMap is designed to fulfill these requirements allowing the user to interactively test different likely scenarios, permiting the generation of a set of fire risk maps for decision support in an operational framework.

Click here to see the fire risk maps associated with the regional fuel map.


Testing of the fire risk maps


Scale effects on fire risk mapping


Testing of alternative vegetation management strategies for minimizing risk

Fire propagation is determined by three main factors: Topography, Fuel and Weather conditions. The only factor that can be subjected to human intervention is fuel.

Fuel can be manipulated by directly altering naturally occuring vegetation loadings and spatial arrangement. Fuel loadings can also be reduced by a long-term management of the tree stands implying a control of the amount of radiation reaching the understory and periodic removal of woody material.

To decide on the addequate degree of intervention we must be able to evaluate the results of alternative vegetation management actions. FireMap can be used as a tool for this purpose enabling a subsequent cost/beneffit analysis.

For demonstration purposes we test three different intervention types for a study site in central Portugal:

  1. Reduce spatial continuity - widening and cleaning of pre-existing pathways.
  2. Reduce fuel loading in shrub patches - grazing / prescribed burning / mechanical cleaning and removal of vegetation
  3. Both 1 and 2