Some
HYDALP Results from the SRM model
This page shows some results obtained
for the BASCH basin during 1996 and 1999
modelling periods.
1996 SRM Results for BASCH
This section shows input and output files for the
SRM modelling carried out, plus figures to illustrate the results. Version
1.3 of the HYDALP SRM-Java implementation (build 30 or higher) is required
to process the SRM input file. Click on an
image to display at full size.
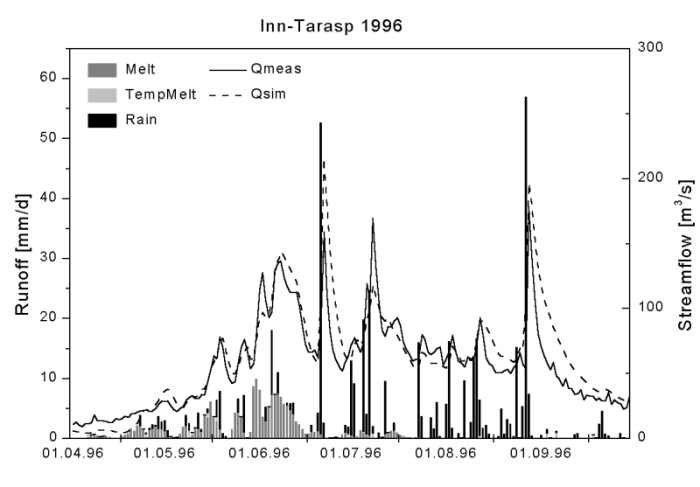
| The figure opposite shows the
stream flow simulation for Spring 1996. |
|
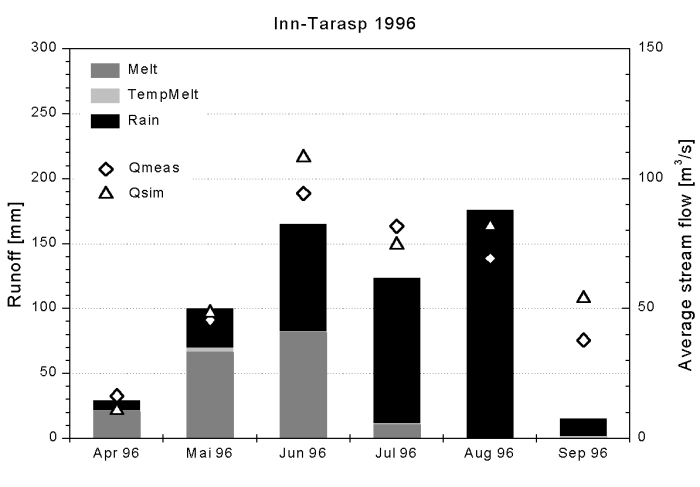
| The figure opposite shows the
monthly runoff generation for Spring 1996. |
  |
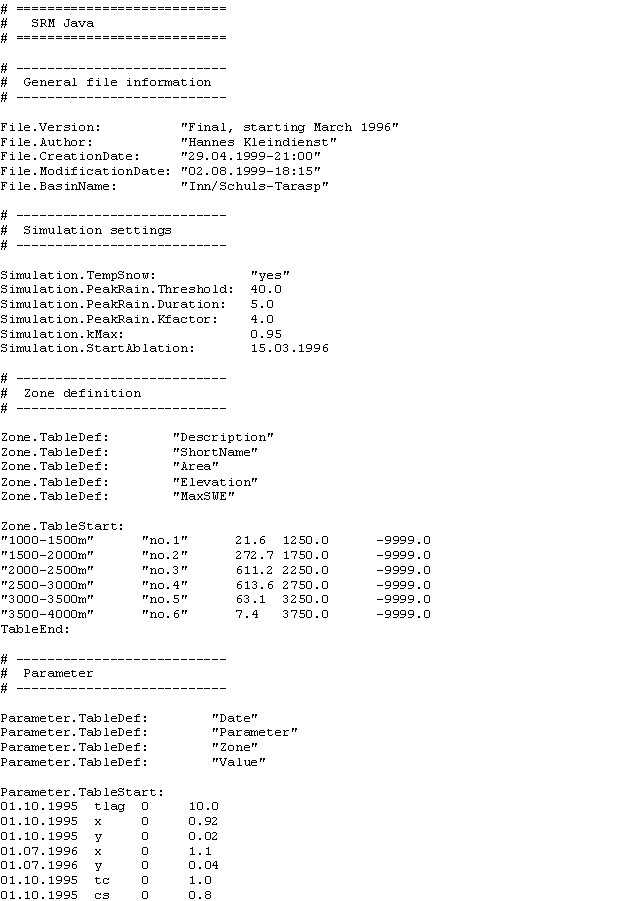
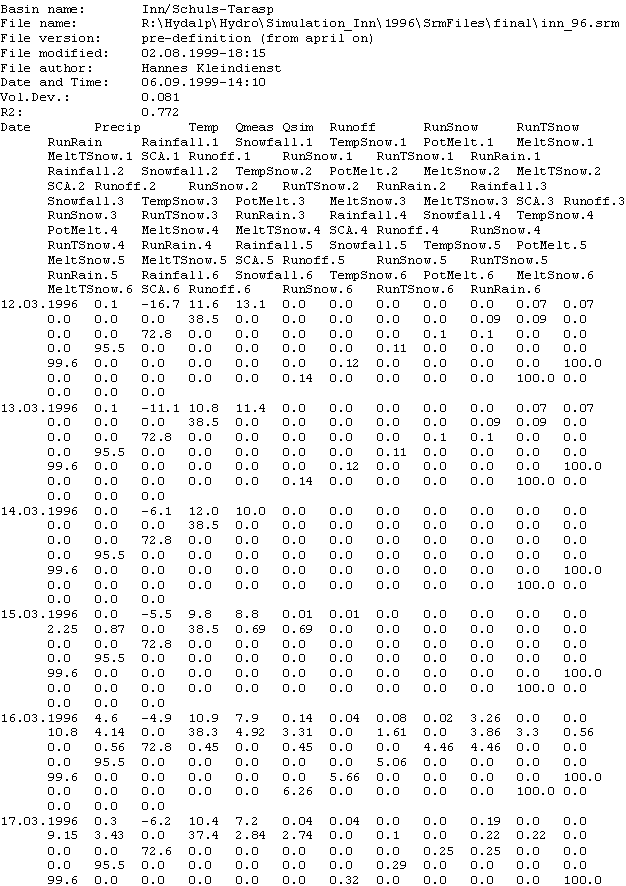
| The figures opposite show the SRM
input file for Spring 1996, and the output generated by using this file
with version 1.3, build 32 of SRM-Java. |
 |
 |
| SRM Input |
SRM Output |
|
1999 SRM Results for BASCH
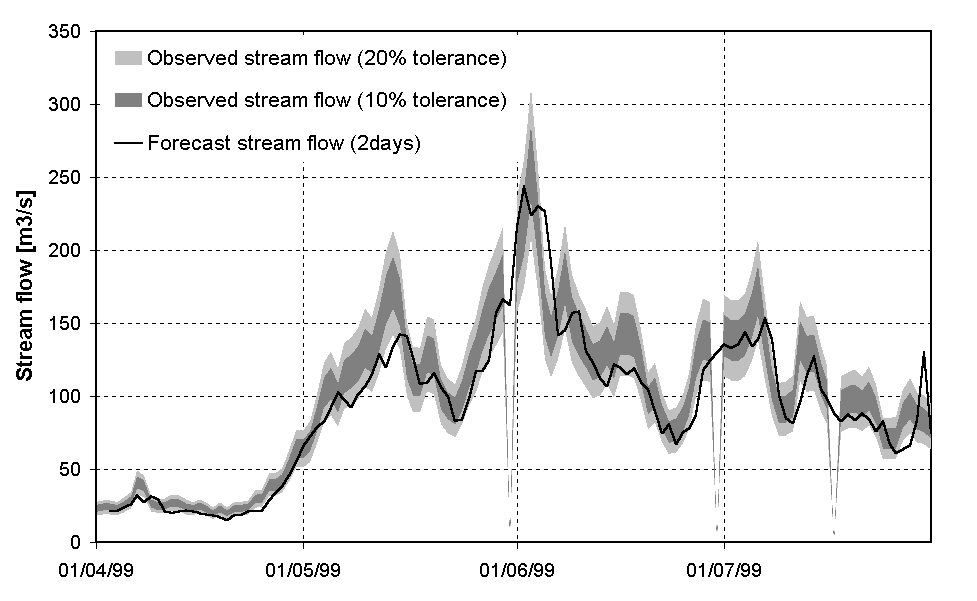
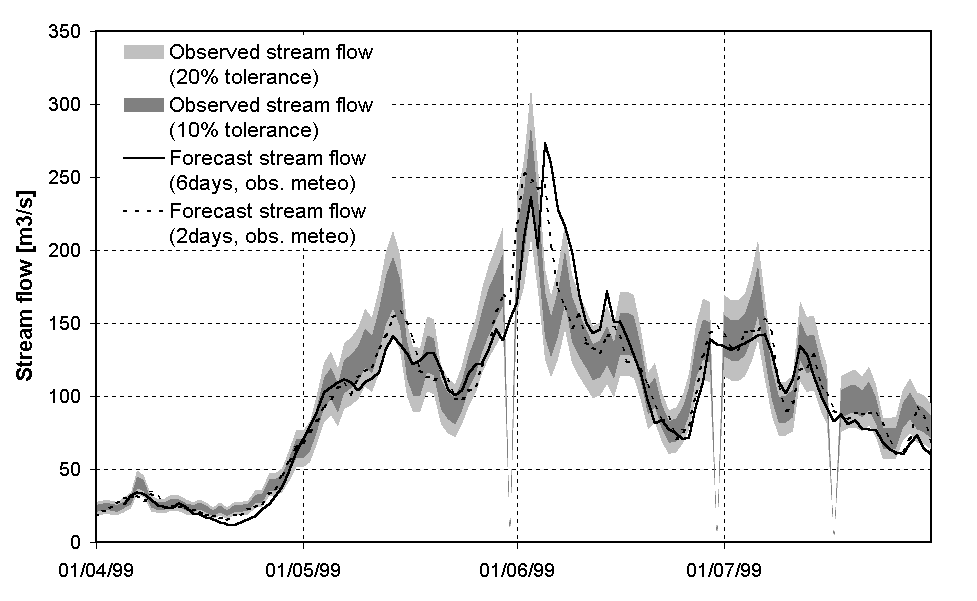
This section shows results from 1999 SRM
modelling for the BASCH basin. These are presented as a number of graphs:
the actual observed stream flow from the basin is shown on each graph by
means of 10% and 20% error bands around the observed flow. Over these
bands, various SRM forecasts can be compared: forecasts made for zero ("Simulated"),
two or six days ahead, with ("obs. meteo") or without ("steady
state" / null) actual Meteorological data observation input.
Click on an image to display at full size
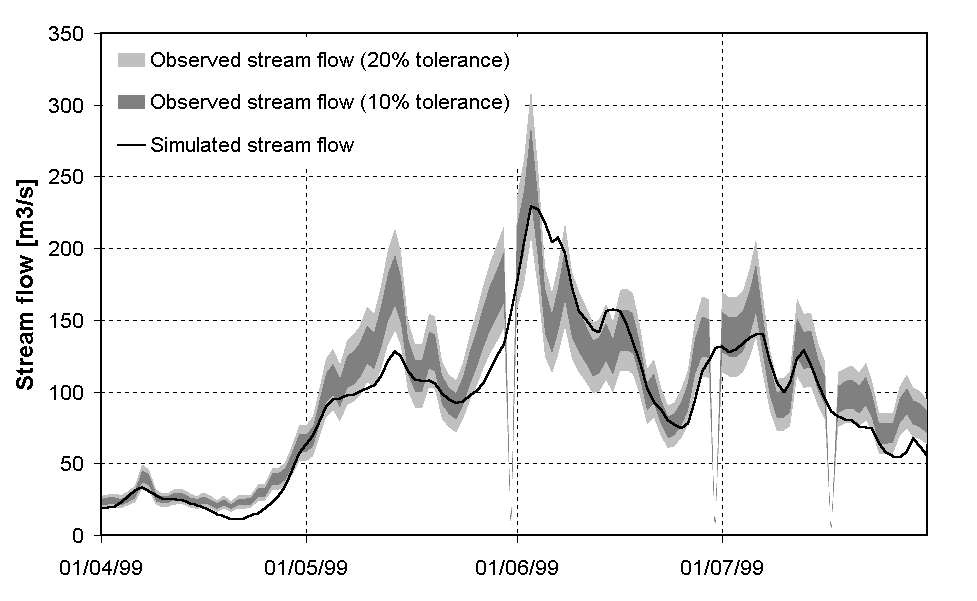 |
Observed stream flow overlaid by stream flow simulation result,
without observed Meteorological data. |
Observed stream flow overlaid by stream flow forecast for 2 days in
advance, using observed Meteorological data. |
 |
|
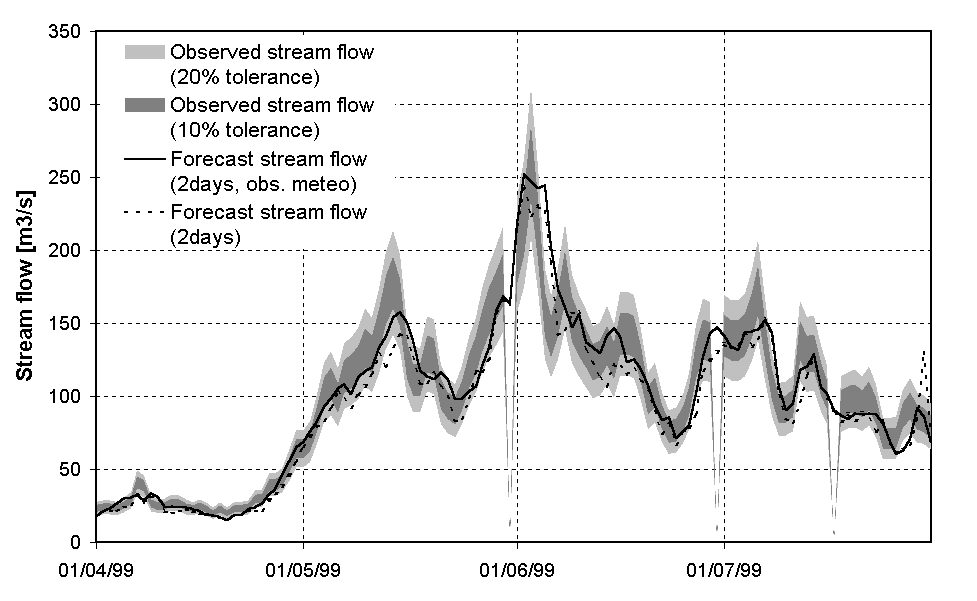 |
Observed stream flow overlaid by stream flow simulation results for
both with and without ( "steady state" ) observed
Meteorological data. |
|
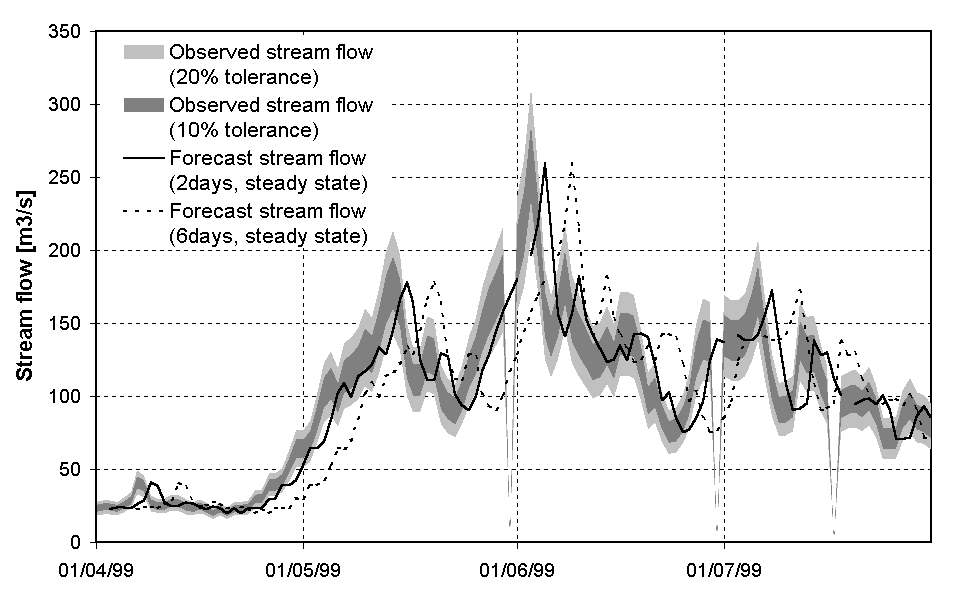 |
Observed stream flow overlaid by 2-day and 6-day stream flow
simulation results, forecast without use of observed Meteorological
data. ("steady state") |
Observed stream flow overlaid by 2-day and 6-day stream flow
simulation results, forecast using observed Meteorological data. |
 |


